02 July 2024
Today, THE PEOPLE’S BANK OF CHINA issued an announcement that “the PBoC has decided to conduct treasury bond borrowing operations for some primary dealers in the open market business in the near future”.
01 July 2024
Michael Howell, managing director at Crossborder Capital and author of “Capital Wars: The Rise of Global Liquidity,” has developed a comprehensive framework for tracking global liquidity — the pool of cash and credit that circulates through financial markets. This concept has proven to be a valuable indicator for future investment performance over recent years.
Understanding Global Liquidity
Howell emphasizes that in a world dominated by debt financing, liquidity affects markets more significantly than interest rates. This is because we are in a refinancing cycle, not a capital investment cycle. Therefore, the capacity of the world’s credit providers’ balance sheets is crucial, especially as vast amounts of existing debt need regular refinancing.
Recent Trends in Global Liquidity
Since late 2022, liquidity conditions have been easing, with international funding markets becoming more favorable. This is evidenced by rising bank share prices and a busy corporate issuance calendar at the start of the year. According to Crossborder Capital, global liquidity flows accelerated into early 2024, expanding at an annual rate of 9% from September, driven primarily by increases in Japan and China. By the end of 2023, global liquidity reached $168.2 trillion, a 3% increase from the previous year. This growth was led by a 3.8% rise in conventional bank credit and a 2.2% increase in shadow banking activity. However, the eurozone and the UK saw a decline in liquidity during this period.
The Role of Central Banks
While the US Federal Reserve publicly emphasizes quantitative tightening (QT), measures indicate significant liquidity injections into US money markets. Although the Fed’s balance sheet contracted by 7.5% in 2023 due to the non-reinvestment of maturing US Treasury holdings, its emergency Bank Term Funding Programme (introduced after the collapse of Silicon Valley Bank) and reduced cash parked in its reverse repo facility contributed to a 13% increase in liquidity injections. This roughly matched the rise in US financial wealth, based on a 60/40 portfolio benchmark of international stocks and US Treasuries.
Looking ahead, central banks are expected to provide more liquidity support as monetary policy easing becomes more prevalent. The People’s Bank of China (PBoC) is a key player to watch, having injected approximately Rmb6.2 trillion ($850 billion) into domestic money markets from mid-2023, reversing its previous tight stance. This local currency credit has had significant international effects, contributing to large capital outflows from China into sovereign bonds. Chinese commercial banks also increased their lending by more than 10% last year, with the shadow banking sector seeing a 4% rise. The PBoC accounted for almost one-fifth of the total increase in global liquidity in 2023, much of which spilled abroad.
Projections for 2024
With many central banks, including the Fed and PBoC, considering greater policy easing, a $5 trillion liquidity contribution is expected from these sources in 2024. Additionally, assuming stability in bond markets, currencies, and commodity prices, collateral-backed lending markets could support a rise in overall global liquidity of about $15 trillion, or close to a 10% gain for the year.
Conclusion
Global liquidity is a critical factor in financial markets, influencing investment performance and economic stability. As central banks shift towards more accommodative monetary policies, we can anticipate significant increases in global liquidity, impacting markets worldwide.
Slowing GDP + Accelerating EPS has historically been the best backdrop for equities. Avg. Q/Q return = 3.6% Positivity rate = 79% $SPX $SPY $QQQ $DIA $IWM
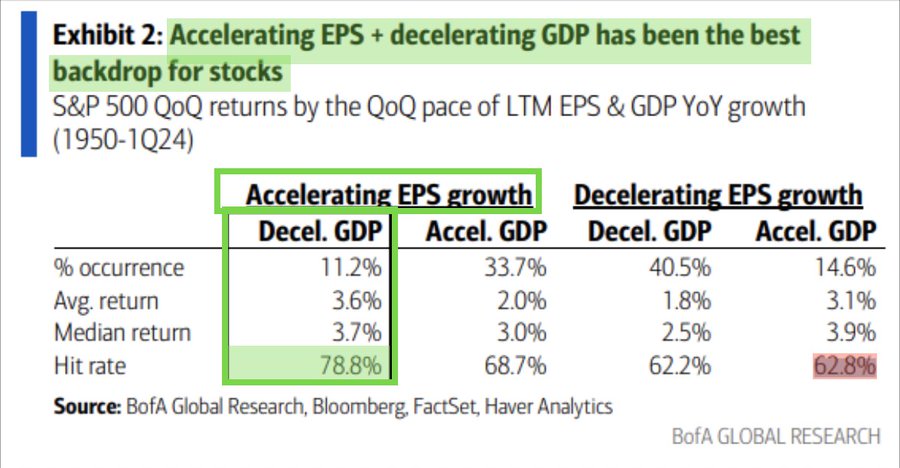
One reason that makes this to happen is that policy makers will try to extend the business cycle by adding liquidity as explained by Michael Howell.
Useful Data
Global liquidity indicators publication table: BIS,GLI_E1,1.0